Mapping US east coast resources
The figures below illustrate the steps for estimating ocean wind power resources. These draw from the Thesis of Scott Baker, UD, 2011. Click on the leftmost image, then “next” to follow the process through for the PJM area, the subject of Baker’s thesis. This study illustrates the method of crossing diverse data sets, essential to understanding and mapping the offshore wind resource.
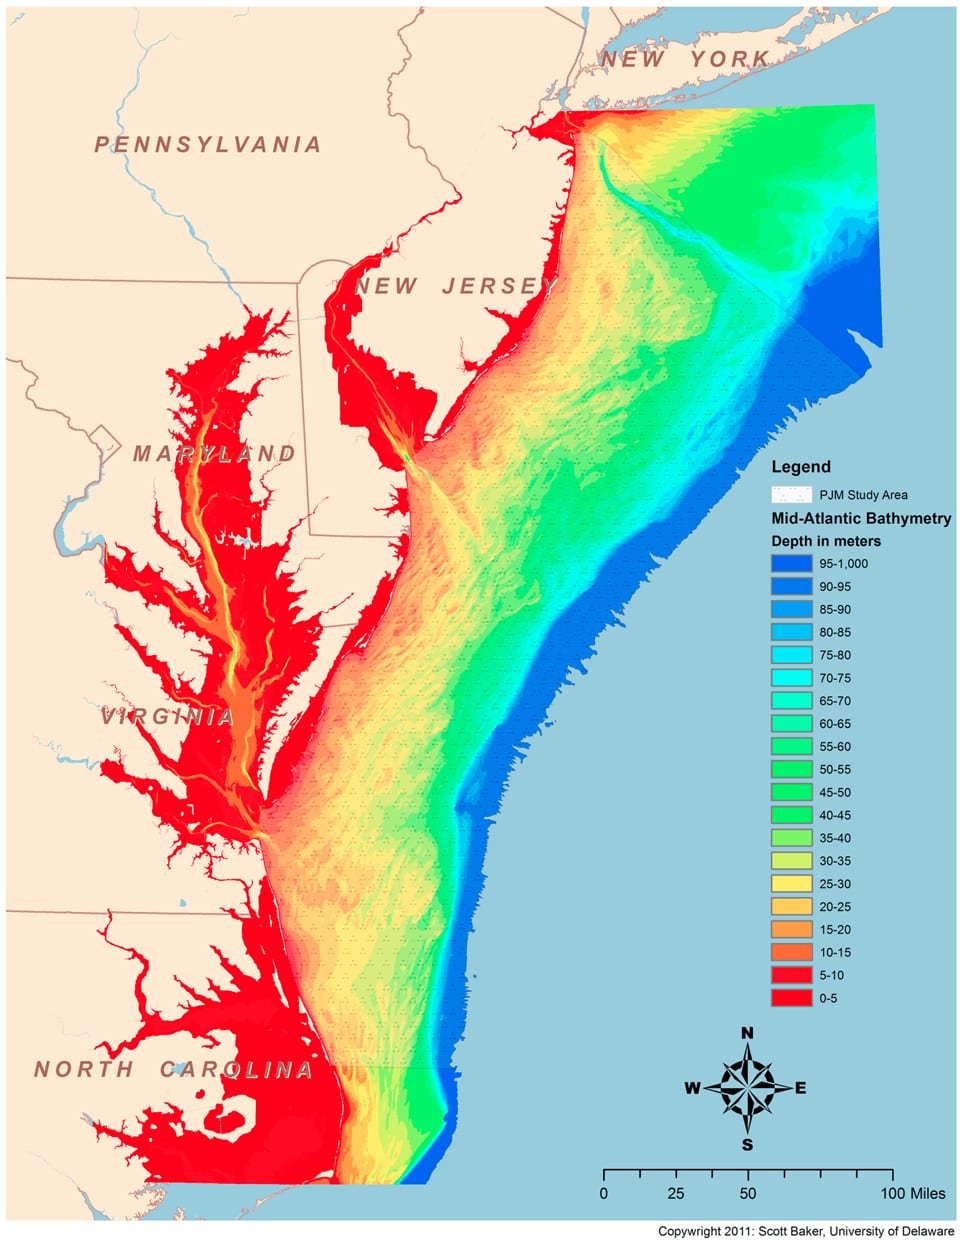
Figure 1
First, the bahymetry possible for both fixed and floating turbines is mapped (Baker 2011, Fig 6)
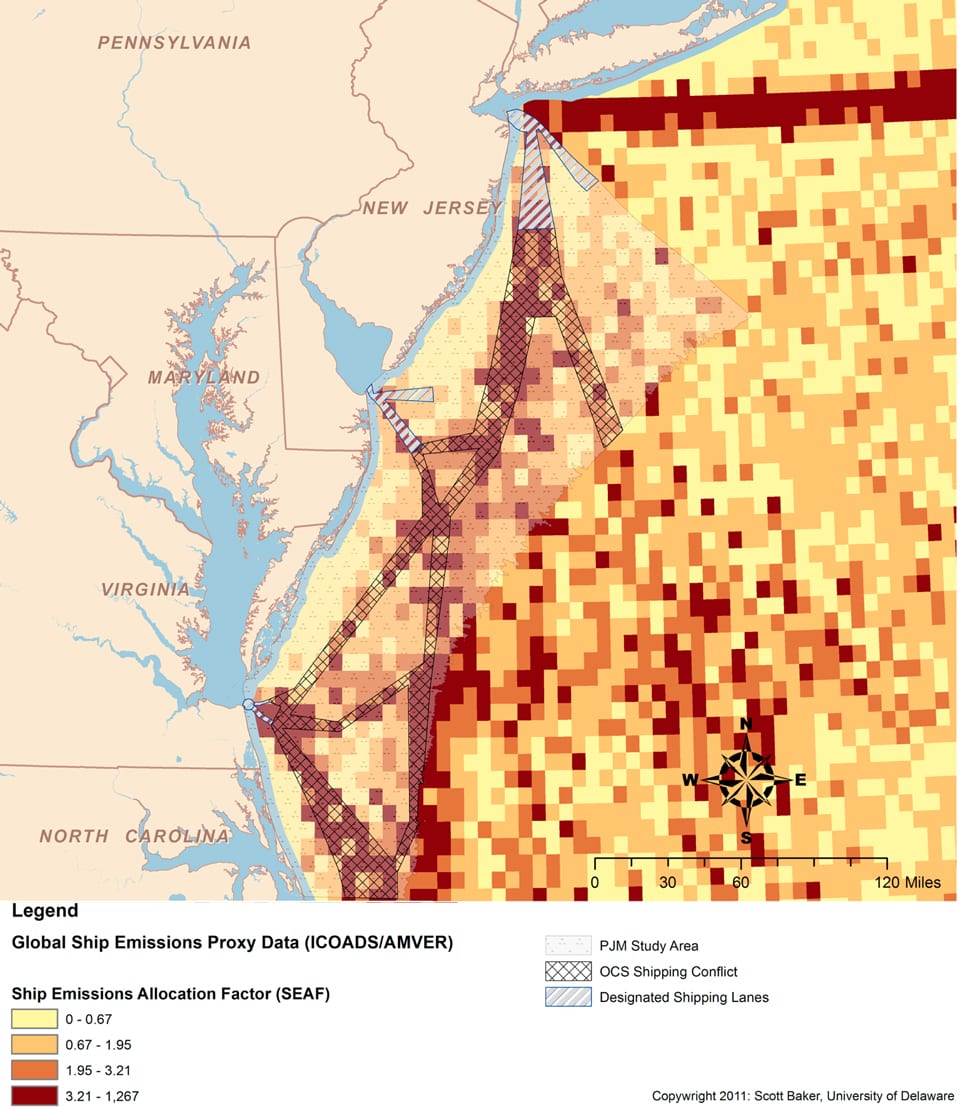
Figure 2
Bathymetric regions are divided into areas appropriate for each type of turbine mounting (Baker 2011, Fig 12)
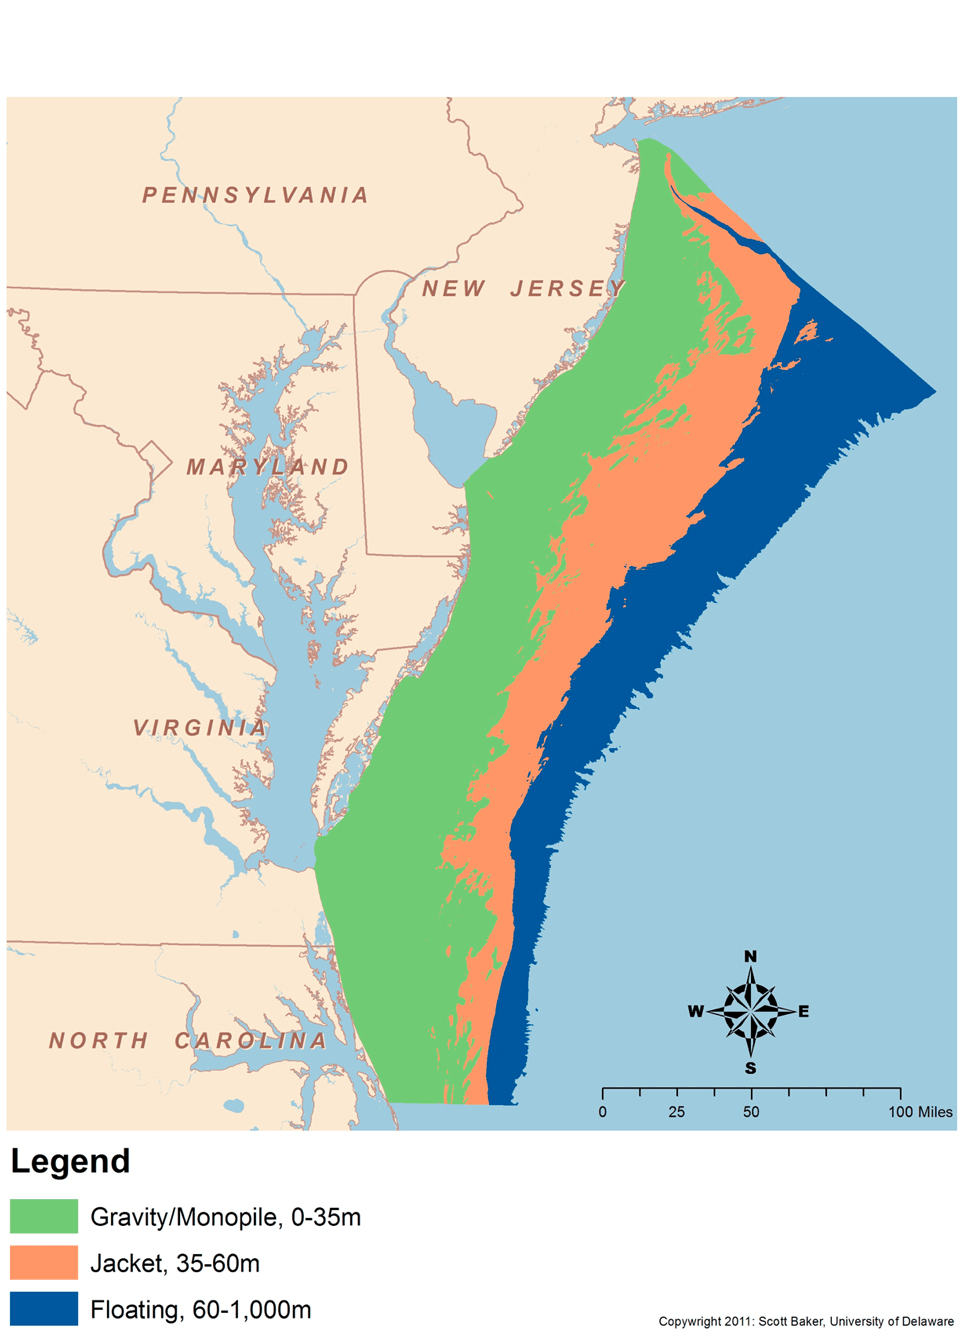
Figure 3
Other uses of the ocean are mapped, one by one. This figure shows travel by ships (Baker 2011, Fig 8).

Figure 4
Bathymetric regions and all conflicting ocean uses are mapped together (Baker 2011, Figs. 13, 14).
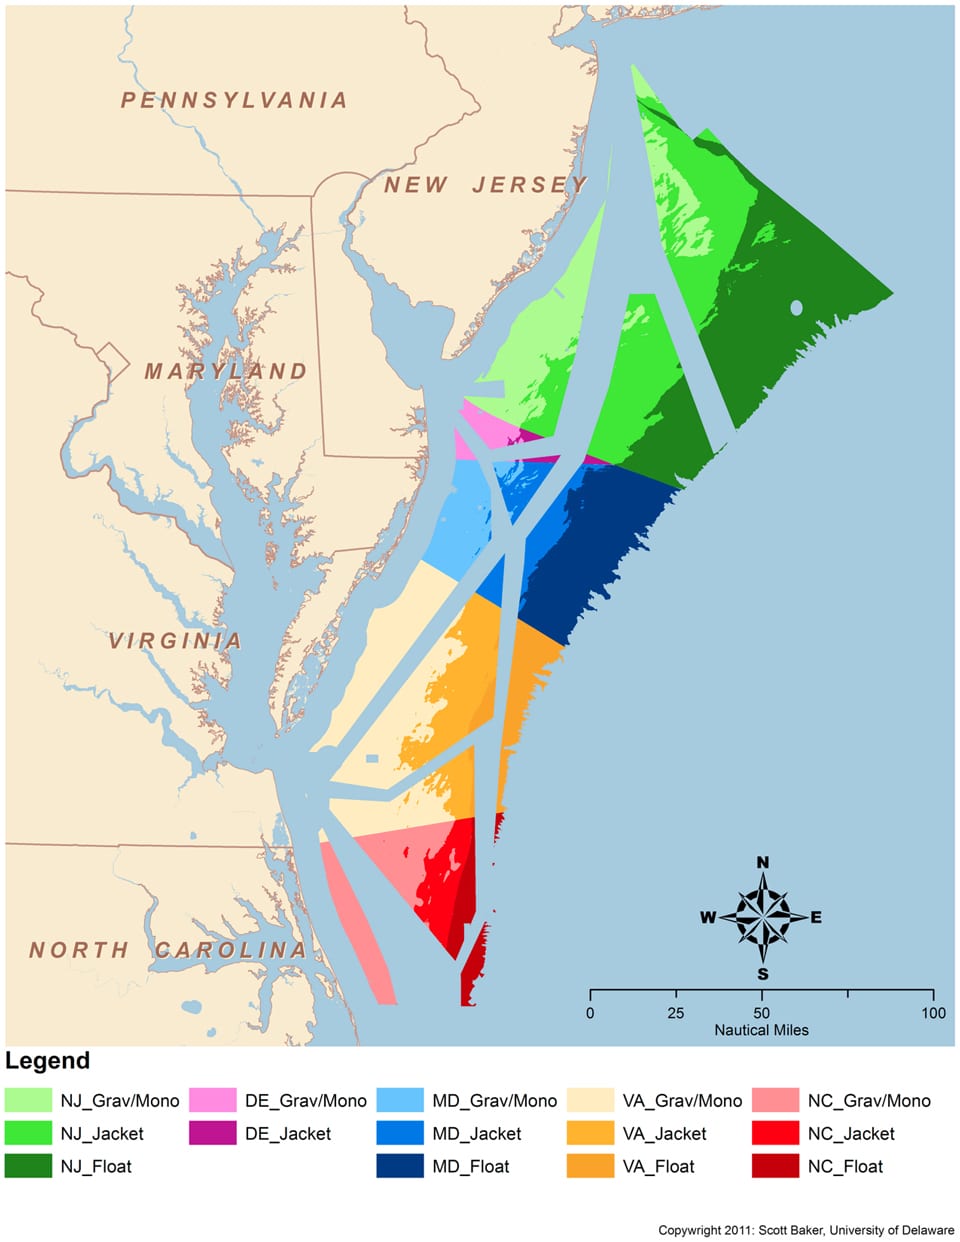
Figure 5
Finally, all potential conflict areas excluded, remaining area potentially for wind turbines (Baker 2011, Fig 15).
Calculations and assumptions used in calculating power from ocean area and wind speed (Baker 2011, Table 5.)
| Variable | Value |
| Mean wind speed @ 90m, ‘Gravity/Monopile | 8.25 m/s |
| Mean wind speed @ 90m, ‘Jacket’ and ‘Floating’ | 8.75 m/s |
| Turbine spacing factor | .7938 km2 (6.3 MW/km2) |
| Turbine availability | 95% (5% loss) |
| Wake effect losses | 10% |
| Capacity factor (CF), 8.25 m/s | 42.92% |
| Capacity factor (CF), 8.75 m/s | 46.80% |
| ‘All-in’ CF, 8.25 m/s | 36/70% |
| ‘All-in’ CF, 8.75 m/s | 40.01% |
Result: output from offshore wind (Baker Table 6). Compare with PJM 2010 load, 745,000 GWh (= 79.6 GWa average).
| Bathymetric class | Wind Energy Area (km2) | Wind Turbines (count) | Nameplate Capacity (MW) | Average Output (MWa) | Annual Energy (GWh) |
| 0-35m | 12,157 | 15,314 | 77,720 | 28,523 | 249,862 |
| 35-60m | 11,468 | 14,447 | 73,316 | 29,335 | 256,974 |
| 60-1,000m | 15,656 | 19,723 | 100,095 | 40,049 | 350,832 |
| Totals | 39,280 | 49,484 | 251,132 | 97,907 | 857,667 |
